Browse a rich array of educational resources from the award-winning show, Habitat Earth.
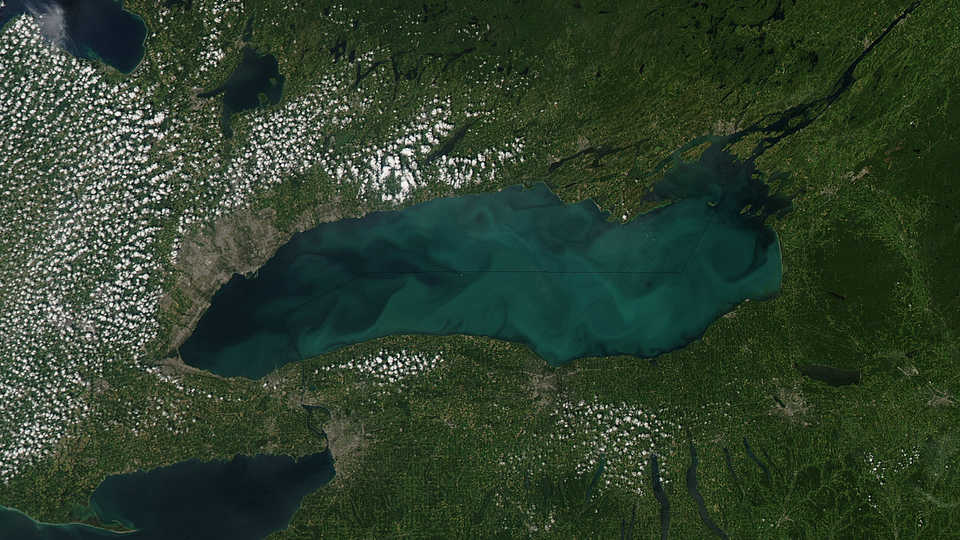
©NASA/GSFC/Jeff Schmaltz/MODIS Land Rapid Response Team
Observations inspire scientific questions and drive discoveries. In this activity, students will watch a visualization of empirical scientific data to explore seasonal changes in primary productivity on the earth. They will then formulate and research their own scientific questions about primary productivity on the earth and present their research in a classroom scientific poster session.
- What factor(s) control(s) changes in primary productivity on land and in the oceans over time?
- How do plants respond to seasonal changes in sunlight?
- What questions can we formulate from empirical scientific data?
After this activity, students will be able to:
- Relate changes in primary productivity in terrestrial and aquatic ecosystems to seasonal changes in sunlight.
- Observe empirical scientific data and formulate hypotheses to describe patterns in the data.
- Formulate researchable scientific questions to better understand or explain observed phenomena.
- Obtain, evaluate, and communicate scientific information from credible sources.
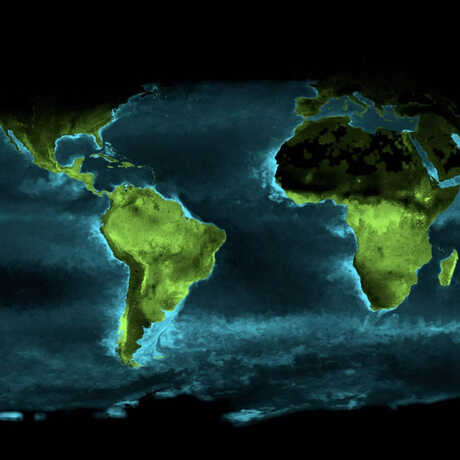
- Timelapse: Photosynthesis Seen from Space visualization clip and projector
- One computer per group of 2 students or access to the school library for research
- One piece of poster board or a large piece of butcher paper per group of 2 students
- Markers, glue sticks, tape, and other craft materials for students to use in constructing their posters
- Test the video quality on your school’s internet connection. Note that you can click the Settings cog in the footer to adjust the Quality to up to 1080HD, and you can also toggle on Full Screen.
- Gather craft materials (see Materials list) for Part II.
- producer: an organism, such as a plant, that can make its own food
- empirical: based on observation, experience, or experimentation; not theoretical
- photosynthesis: the process by which a cell capture energy in sunlight and uses it to make food
- primary productivity (in the context of photosynthetic producers as opposed to chemosynthetic producers): a measure of the rate at which new organic matter is developed through photosynthesis in producer organisms based on the oxygen released and carbon taken in; the transformation of solar energy to biomass
- phytoplankton: plant-like plankton, primarily microscopic algae and protozoa, that carry out photosynthesis
- hypothesis: a possible explanation for a set of observations or answer to a scientific question; must be testable
Observations inspire scientific questions and drive discoveries. In Part I of this activity, students will watch a short visualization clip showing global seasonal changes in photosynthesis on the earth to practice making observations and formulating hypotheses using empirical scientific data. Students will witness how scientific questions evolve from observations, and in Part II they will practice forming their own science questions.
- Show students the Timelapse: Photosynthesis Seen from Space visualization clip. Pause the clip BEFORE 00:30. (If you want to keep the topic a secret, skip past the title slides.)
- Ask students to describe what they are seeing in the clip. Facilitate the process of focusing on observations (and not yet making interpretations) by giving the students sentence structures to work with, such as “I observe…”, “I notice…”, or “I wonder why…”
- After a brief discussion about their observations, ask students to make a hypothesis (tentative interpretation) about what the clip is showing. Write down some of the hypotheses on the board.
- Continue playing the clip, and pause it again BEFORE 01:00.
- Ask students to describe what carbon absorption might mean. What processes in nature that occur both on land and in the oceans absorb carbon? One of the processes that absorbs carbon in nature is photosynthesis (see more in the Carbon Cycle Role-Play). The blue and green colors in this clip represent net primary productivity, which is the total carbon produced by plants through photosynthesis minus the carbon respired by the plants.
- Encourage students to notice how the colors on the map change through time as they watch the rest of the clip. At the end of the clip, have students write down their observations about these changes. You may need to play the entire clip again for students to give them more time to make observations.
- Have students get together with a partner and share their observations.
- Ask students to think about what might control where and when photosynthesis occurs on the earth.
- Ask students to discuss their thoughts with their partners for a few minutes, and then share their ideas with the class.
- One of the primary factors that controls where and when photosynthesis occurs on the earth is sunlight intensity. This factor is what can be inferred from the visualization, which shows how primary productivity on the earth’s surface changes seasonally as sunlight intensity at different latitudes varies due to the earth’s tilt (see Background for Educators). Depending on the prior knowledge or level of your students, this discussion might warrant a quick discussion about the seasons and seasonality:
- This brief video illustrates how the Earth’s tilt and rotation changes the angle at which sunlight hits the surface of our planet, creating the different seasons we experience here on Earth.
- Teacher Tip: There are many other questions that could be posed around the information presented in the Timelapse: Photosynthesis Seen From Space visualization. Scientists ask a lot of questions about the world, and these questions are what guide their research. After scientists have conducted their research, they often present their results to other scientists at scientific conferences (like really big science fairs). At these conferences, scientists may bring posters describing their research to share with their peers. In the second part of this activity, students will create their own scientific posters for a scientific poster session with their classmates.
- Remind students of the questions they considered in Part I about the data shown in the clip. There are many other questions we could ask about the data. After watching the clip a second time, students should brainstorm questions with their partners, choose the one they like best (with teacher guidance), and research their question using credible sources. You can structure the research in whatever way you think is appropriate for your students (e.g., requiring a minimum number of sources).
Examples of research questions:- Why do some regions stay dark/black while other regions are more productive?
- Why are the centers of ocean basins less productive than other regions of the ocean?
- Where is primary productivity the most prevalent and why?
- Why are the regions around the coastlines of the continents generally very productive?
- Are there other factors that influence or affect productivity in some of these regions besides sunlight?
- How is this data collected? How do scientists ‘see’ photosynthesis from space?
- Do El Niño and La Niña years change these patterns?
- Has climate change affected these patterns over time?
- Assign research as individual homework, so that students can return with information and sources they can synthesize and critique as a group.
- (40 minutes) As a group, students should design and make a poster describing the research they did to address their question and what they found. Students can be given a basic structure for how to present the information on their poster, such as:
- What their question is and what about the information/data presented in the visualization clip led them to asking this question.
- Background information
- Supporting research they found that provided insight or answers to their question
- Any uncertainties in the scientific community surrounding their question
- If your students could design an experiment to find an answer to their question, what it might look like
- Bibliography of sources
- Any other points you would like your students to address
- Students can either type up information for their poster, print it out, and glue it onto their posters, or write the information directly onto their posters with pens or markers. Encourage students to write information in their own words, include pictures or diagrams they find or draw on their posters, and make their posters colorful and interesting.
- Give students 20 minutes for their ‘poster session.’ For the first ten minutes, one partner will stand by the poster ready to answer questions while the other partner walks around to see the other posters, and for the last ten minutes the partners will switch. To encourage engagement and interaction, you can ask the students to write down one thing they learned from each of the posters that were presented, or to provide constructive feedback to their classmates using sticky notes (see this tool for Ambitious Science Teaching).
- At the end of the 20-minute poster session, bring students back together and have them share some of the things they learned from their classmates’ posters.
- Did anything surprise them?
- How were the other scientific questions similar to or different from their own?
- Were there any questions that did not have a solid answer?
- Discuss with students the difference between ‘scientific questions’ and other general questions. The answers to scientific questions come from investigations, data, and evidence. Ask your students to describe the evidence they found in their research that helped them answer their scientific question.
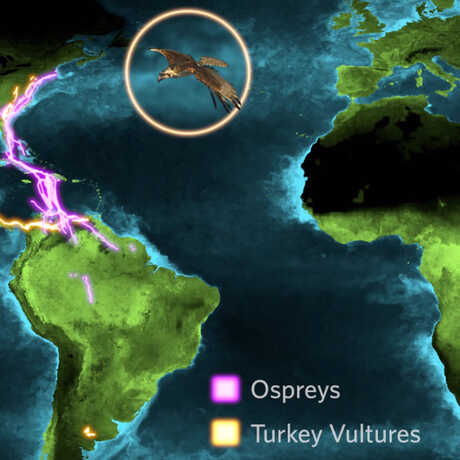
- Follow this lesson with another based on a similar visualization: Why Do Birds Migrate?
- Relate patterns in net primary productivity to a map of earth’s biomes. Have students try to identify the locations of various biomes on a global map using the information in the Photosynthesis Seen From Space clip.
Living plants play an extremely important role in regulating the amount of carbon dioxide (CO2) in the atmosphere. Through photosynthesis, plants take in CO2 and convert the carbon into sugar molecules (carbohydrates) using water and energy from the sun. In the process of breaking down these molecules and creating food for themselves, plants release oxygen back into the atmosphere for humans and animals to breathe. This process occurs in land plants, in algae, and in other primary producers of our oceans, such as microscopic phytoplankton.
Although CO2 is broken down during photosynthesis, some CO2 is released back into the atmosphere as plants respire. The amount of CO2 taken in by vegetation during photosynthesis minus the amount of CO2 put out during respiration equals Net Primary Productivity (NPP), or the total amount of CO2 absorbed by plants (NASA, retrieved May 2015):
CO2 taken in – CO2 respired out = Total CO2 absorbed by vegetation = Net Primary Productivity
The chemical reaction by which plants produce complex food molecules requires an energy input from sunlight to occur. On land and in the ocean, the availability of light from the sun limits the amount of energy plants can use for photosynthesis, in turn limiting the amount of CO2 they are able to take in. The seasonal variability of light and its effect on NPP is illustrated in the Timelapse: Photosynthesis Seen from Space visualization. An increase in NPP is reflected in both the Northern and Southern Hemispheres during their respective summer months. Each hemisphere is exposed to more direct sunlight during its summer season because it is tilted towards the sun, therefore increasing the amount of energy available to producers.
While sunlight has a great impact on NPP, there are some variations in productivity due to other factors on land and in water that also influence the amount of CO2 plants are able to absorb (Lindsey, 2003) Notice that some land regions on the map show very little NPP year round. Some deserts, such as the Sahara in Africa, may receive an abundance of sunlight depending on their distance to the equator; however, the lack of available water limits the extent plants can photosynthesize during the daytime for fear of desiccating, resulting in a lower amount of carbon absorbed by plants living in these climates.
In the ocean, the availability of nutrients, especially nitrogen, greatly impact NPP (Behrenfeld, 2006). Water bodies with an abundance of nutrients tend to have a higher phytoplankton population. An increase in the distribution of phytoplankton means an increase in the amount of CO2 being absorbed during photosynthesis, and an increase in the NPP of that region.
In addition to providing oxygen and regulating carbon levels, plants contribute immensely to the success of human culture and economies. Both on land and in the ocean, plants provide energy and nutrients vital to the growth of consumers higher on the food chain (National Wildlife Federation, retrieved May 2015). For humans, these plants provide more than just energy and nutrients in the form of food. Plant products like paper, clothing, and medicine have significantly shaped and influenced the development of human cultures and contribute greatly to the foundation of human economies.
Disciplinary Core Ideas (6-8)
- LS1.C: Organization for Matter and Energy Flow in Organisms: Plants, algae (including phytoplankton), and many microorganisms use the energy from light to make sugars (food) from carbon dioxide from the atmosphere and water through the process of photosynthesis, which also releases oxygen. These sugars can be used immediately or stored for growth or later use.
- PS3.D: Energy in Chemical Processes and Everyday Life:
- The chemical reaction by which plants produce complex food molecules (sugars) requires an energy input (i.e., from sunlight) to occur. In this reaction, carbon dioxide and water combine to form carbon-based organic molecules and release oxygen.
- Cellular respiration in plants and animals involve chemical reactions with oxygen that release stored energy. In these processes, complex molecules containing carbon react with oxygen to produce carbon dioxide and other materials.
Science and Engineering Practices (6-8)
- Analyzing and Interpreting Data:
- Use graphical displays (e.g. maps, charts, graphs, and/or tables) of large data sets to identify temporal and spatial relationships.
- Analyze and interpret data to provide evidence for phenomena.
- Asking questions:
- Ask questions that arise from careful observation of phenomena, models, or unexpected results, to clarify and/or seek additional information.
- Obtaining, Evaluating, and Communicating Information:
- Critically read scientific texts adapted for classroom use to determine the central ideas and/or obtain scientific and /or technical information to describe patterns in and/or evidence about the natural and designed world(s).
- Integrate qualitative and/or quantitative scientific and/or technical information in written text with that contained in media and visual displays to clarify claims and findings.
- Communicate scientific and/or technical information in writing and/or through oral presentations.
Cross-Cutting Concepts (6-8)
- Patterns
- Graphs, charts, and images can be used to identify patterns in data.
- Patterns can be used to identify cause and effect relationships.
- Cause and Effect
- Empirical evidence is required to make claims about specific causes and effects.
- Energy and Matter: Flows, Cycles, and Conservation
- Within a natural or designed system, the transfer of energy drives the motion and/or cycling of matter.
- Principle III: Natural systems proceed through cycles that humans depend upon, benefit from and can alter.
- Concept a: Students need to know that natural systems proceed through cycles and processes that are required for their functioning.
Behrenfeld, M. J., O’Malley, R.T., Siegel, D.A., McClain, C.R., Sarmiento, J.L., Feldman, G.C., Milligan, A.J., Falkowski, P.G., Letelier, R.M., & Boss, E.S. (2006). Climate-driven Trends in Contemporary Ocean Productivity. Nature 444, 752-755.
Lindsey, R. (2003) Global Garden Gets Greener. Retrieved August 2015 from the NASA Earth Observatory website: http://earthobservatory.nasa.gov/Features/GlobalGarden/
National Wildlife Federation (n.d.). Food Webs and Bioaccumulation. Retrieved May 2015 from http://www.nwf.org/Wildlife/Wildlife-Conservation/Food-Webs.aspx
NASA (n.d.) Global Maps: Net Primary Productivity. Retrieved May 2015 from http://earthobservatory.nasa.gov/GlobalMaps/view.php?d1=MOD17A2_M_PSN
