Browse a rich array of educational resources from the award-winning show, Habitat Earth.
© Claudia Daggett
The connectivity of regions around the globe made possible by air travel and other transportation modes comes with environmental costs, such as increased carbon emissions from the burning of fossil fuels. In this activity, students will be transformed into strategically low-impact world travelers.
How can we minimize our carbon emissions while traveling?
Students will
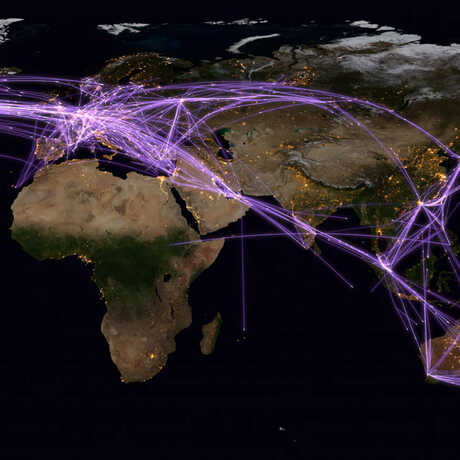
- Examine the impact of travel and transportation on global carbon emissions.
- Design an international travel plan that is both environmentally-friendly and realistic in adhering to certain limitations, such as time and feasibility.
- How Many Planes Are in the Sky? visualization clip
- Computers (at least one, but ideally more, per group of 2-4 students) with online access and Google Earth
- Calculators
- Group Worksheets (1 per group)
- Transportation Logs (1-2 per student)
- Map of Destinations and Major Airport Locations (1-2 per group)
- Reflection Sheets (1 per student)
- Teacher Tips
- Print out one Group Worksheet per group of 2-4 students.
- Print out 1-2 Transportation Logs per student (this accounts for any changes student might make in their plan that would require a fresh worksheet)
- Print out 1-2 Maps per group.
- Print out one Reflection Sheet per student.
- Test the video quality on your school’s internet connection. Note that you can click the Settings cog in the footer to adjust the Quality to up to 1080HD, and you can also toggle on Full Screen.
- carbon dioxide: a colorless, odorless gas that is present in the atmosphere, formed during respiration, produced during organic decomposition, used by plants in photosynthesis, and formed when any fuel containing carbon is burned
- climate change: a regional change in temperature and long term weather patterns
- fossil fuel: a hydrocarbon deposit, such as petroleum, coal, or natural gas, derived from living matter of a previous geologic time and used for fuel
- greenhouse gases: gases in Earth’s atmosphere that absorb and reradiate heat near the surface of the planet
It is recommended that you introduce your students to the environmental effects of burning fossil fuels, how humans have changed the concentration of carbon dioxide in the atmosphere over time, and why we care prior to integrating this activity into your classroom. Here are some helpful resources and activities:
- Show students the How Many Planes Are in the Sky? visualization clip. Ask students to describe what they see:
- How many airplanes do you think are in the sky at any moment?
- How far do the farthest planes fly? Why do their paths appear curved in this clip?
- Do you think people are traveling more on airplanes now than they did 50 years ago? Why? Where are they going?
- Do airplanes have any impacts on the environment? What makes an airplane go/what fuels it? Are they any byproducts of this fuel?
- How many gallons of fuel do you think are used by a jumbo jet flying across the ocean?
- How do you think the amount of carbon dioxide emitted by an airplane compares to the amount emitted by a car? How about a train? A bicycle?
- Divide students into groups of 2-4. Students will be proceeding through this activity as a group. Each group should have access to at least one computer with the internet and Google Earth.
- Tell students that they are going to be participating in a reality TV show competition where they will be traveling to various destinations around the globe. Give students a brief overview of the competition (see below), then pass out the Student Worksheets and Maps of Destinations and Airport Locations, and go over the competition rules and details (see below).
- Students will likely need a full class period to map out their trip plan and do their calculations.
Competition Overview
- The winner of the competition is the group who successfully visits all of the required destinations with the lowest carbon emissions possible.
- Groups must visit all of the required destinations, starting and ending in San Francisco, within the allocated time (40 days). Groups who take longer than the allocated time will be disqualified from the competition.
- Groups must travel to all specified destinations, but can do so in whatever order they choose (starting and ending in San Francisco) and using whatever modes of transportation they choose, as long as they are feasible (more details below).
Competition Rules and Details
- Modes of Transportation:
- To get to most of the destinations, groups will need to utilize multiple modes of transportation (e.g., plane + train), since not all locations have an airport that they can fly directly into (see the Map). Students can use as many or as few modes of transportation as they want and can split their travels up into as many segments as they want. For example, students can travel from Sao Paulo-Guarulhos International Airport to Manaus, Brazil (~1676 miles) half by bicycle (838 mi) and half by car (838 mi).
- Modes of transportation must be physically feasible (e.g., a car cannot be driven over the ocean). Students can choose a feasible mode of transportation between destinations even if the option does not actually exist (e.g., a train can be taken over land even if no real train line exists).
- To get to most of the destinations, groups will need to utilize multiple modes of transportation (e.g., plane + train), since not all locations have an airport that they can fly directly into (see the Map). Students can use as many or as few modes of transportation as they want and can split their travels up into as many segments as they want. For example, students can travel from Sao Paulo-Guarulhos International Airport to Manaus, Brazil (~1676 miles) half by bicycle (838 mi) and half by car (838 mi).
- Carbon Emissions and Time Tracking
- Students will plan out their travels. They should be given access to a computer with the internet and Google Earth. They can re-watch the How Many Planes Are in the Sky? clip as well as use Google Earth to help them with their decisions.
- For each segment of their trip, students must calculate and keep track of (using their Transportation Logs) the total carbon emissions per person for the mode of transportation they use. There is an example calculation on their Group Worksheet.
- Students must calculate and keep track of how long (hrs) each segment of their trip will take them to ensure that they can complete the trip in the allotted time. How long a particular segment takes them will depend both on the distance they are traveling as well as the average speeds of their modes of transportation. Students can measure distances on the globe using the Ruler tool in Google Earth. Make sure before students start that their Ruler tool is set to measure distances in miles, since the transportation speeds are given in units of miles per hour. There is an example calculation on their Group Worksheet.
- Students will plan out their travels. They should be given access to a computer with the internet and Google Earth. They can re-watch the How Many Planes Are in the Sky? clip as well as use Google Earth to help them with their decisions.
Encourage the groups to keep their plans confidential—remind them that it is a competition!
- Hand out a Reflection Sheet to each student, and ask them to spend about 10 minutes answering the questions on it.
- Ask each group to briefly present their trip plans to the class, and then announce the winning group with the lowest carbon emissions.
- Discuss the activity:
- What strategies did you use to design your trip?
- What are some of the advantages and disadvantages of the transportation modes with lower carbon emissions?
- Did you see a relationship between the speed/efficiency of a mode of transportation and its carbon emissions?
- Is your trip design realistic? For example, did you plan in any time for sleeping? Is it possible to ride a bicycle through the rainforest?
- Do you/how do you think the carbon emissions value given to you for a cruise ship in the table on your worksheet would be different if instead it was a sailboat?
- What do you think the visualization clip you watched of global air traffic will look like 50 or 100 years from now? What effects do you think this might have on the amount of CO2 in the atmosphere?
- What effects do you think global travel is having on the ecosystems in some of the places you visited during this activity?
- How do you think/what actions could you take to be a more environmentally-friendly traveler?
- Challenge your students to redesign one form of transportation (plane, car, train, boat) to make it more fuel efficient.
- Ask your students to brainstorm ways to travel with a smaller carbon footprint.
- Invite your students to design an ‘eco-resort’ in one of the destinations they visited on their imaginary trip to promote conservation and environmental awareness.
We use fossil fuels for most of our energy needs today. In 2012, fossil fuels like coal, natural gas, and oil accounted for 87% of global primary energy consumption (Gonzalez & Lucky, 2013). In 2013, the burning of petroleum-based fuels to power various modes of transportation, including cars, trucks, trains, ships, and planes, accounted for 27% of total greenhouse gas emissions in the United States (US EPA, 2015).
The burning of fossil fuels has increased the levels of heat-trapping greenhouse gases in the atmosphere since pre-industrial times. Carbon dioxide is a greenhouse gas that occurs naturally in the Earth’s atmosphere as part of the carbon cycle. The natural greenhouse effect keeps the Earth warm enough to sustain life, but human activities are amplifying this effect. Some of the potential effects of global climate change are an increase in wildfires, longer periods of drought, and an increase in the duration and intensity of tropical storms. The rising temperature will also cause a rise in sea level due to the melting of glacial ice and the thermal expansion of warmer seawater, which in turn will cause flooding in coastal areas. (NASA, retrieved August 2015).
The connectivity of countries around the globe made possible by air travel and other forms of transportation comes at an environmental cost. Tourism accounts for more than 60% of air travel (UNEP, retrieved July 2015), and is responsible for about 5% of global carbon dioxide emissions (UNWTO, 2008). Some air traffic forecasts project as much as a 500% increase in air traffic carbon emissions by 2050 (Lee et al., 2013).
Increasing concerns about the impacts of global travel on energy consumption and the environment has inspired a movement towards more sustainable and eco-friendly tourism. Organizations like the Union of Concerned Scientists have released data and published reports that not only compare the carbon footprints of various modes of transportation, but also share information about how one can decrease his or her own carbon footprint while traveling (Union of Concerned Scientists, 2008). In the world of aviation technology and engineering, companies like Boeing and Pratt are working towards designing more aerodynamic airplane and more fuel efficient engines to minimize both costs and emissions (Gross, 2013).
Disciplinary Core Ideas (6-8)
- MS-ESS3.C: Human Impacts on Earth Systems: Typically as human populations and per-capita consumption of natural resources increase, so do the negative impacts on Earth unless the activities and technologies involved are engineered otherwise.
Science and Engineering Practices (6-8)
- Designing solutions to real-world problems:
- Undertake a design project, engaging in the design cycle, to construct and/or implement a solution that meets specific design criteria and constraints.
- Optimize performance of a design by prioritizing criteria, making tradeoffs, testing, revising, and retesting.
- Using mathematics and computational thinking:
- Use digital tools and/or mathematical concepts and arguments to test and compare proposed solutions to an engineering design problem.
Cross-Cutting Concepts (6-8)
- Energy and Matter: Flows, Cycles, and Conservation: Within a natural or designed system, the transfer of energy drives the motion and/or cycling of matter.
- Principle IV: The exchange of matter between natural systems and human societies affects the long-term functioning of both.
- Concept a: Students need to know that the effects of human activities on natural systems are directly related to the quantities of resources consumed and to the quantity and characteristics of the resulting byproducts.
- Concept b: Students need to know that the byproducts of human activities are not readily prevented from entering natural systems and may be beneficial, neutral, or detrimental in their effect.
Planefinder.net
Pinkfroot, LTD
Gonzalez, M. & Lucky, M. (2013) Fossil Fuels Dominate Primary Energy Consumption. Worldwatch Institute. Retrieved August 2015 from http://www.worldwatch.org/fossil-fuels-dominate-primary-energy-consumption-1
Gross, T.K. (2013) Reshaping Flight for Fuel Efficiency: Five Technologies on the Runway. National Geographic. Retrieved August 2015 from http://news.nationalgeographic.com/news/energy/2013/04/130423-reshaping-flight-for-fuel-efficiency/
Lee, D.S., Lim, L.L. & Owen, B. (2013) Bridging the Aviation CO2 Emissions Gap: Why Emissions Trading is Needed. Manchester Metropolitan University, Centre for Aviation Transport and the Environment. Retrieved August 2015 from: http://www.cate.mmu.ac.uk/projects/bridging-the-aviation-co2-emissions-gap-why-emissions-trading-is-needed/
NASA (n.d.). The current and future consequences of global change. Retrieved August 2015 from http://climate.nasa.gov/effects/
Sightline Institute (n.d.). How Low-Carbon Can You Go: The Green Travel Ranking. Retrieved July 2015 from http://www.sightline.org/research/graphics/climate-co2bymode/
Union of Concerned Scientists (2008). Getting There Greener: The Guide to Your Lower-Carbon Vacation. Cambridge, MA: UCS Publications. http://www.ucsusa.org/sites/default/files/legacy/assets/documents/clean_vehicles/greentravel_report.pdf
United States Environmental Protection Agency (U.S. EPA) (2015). U.S. Greenhouse Gas Inventory Report: 1990-2013. http://www.epa.gov/climatechange/emissions/usinventoryreport.html
United Nations Environment Programme (UNEP) (n.d.). Tourism’s Three Main Impact Areas. Retrieved July 2015 from http://www.unep.org/resourceefficiency/Business/SectoralActivities/Tourism/FactsandFiguresaboutTourism/ImpactsofTourism/EnvironmentalImpacts/TourismsThreeMainImpactAreas/tabid/78776/Default.aspx
UNWTO (2008) Climate Change and Tourism: Responding to Global Challenges. Madrid, Spain: World Tourism Organization and United Nations Environment Programme.